Data harmonization in retail: how to handle inconsistent categorizations across your data sources
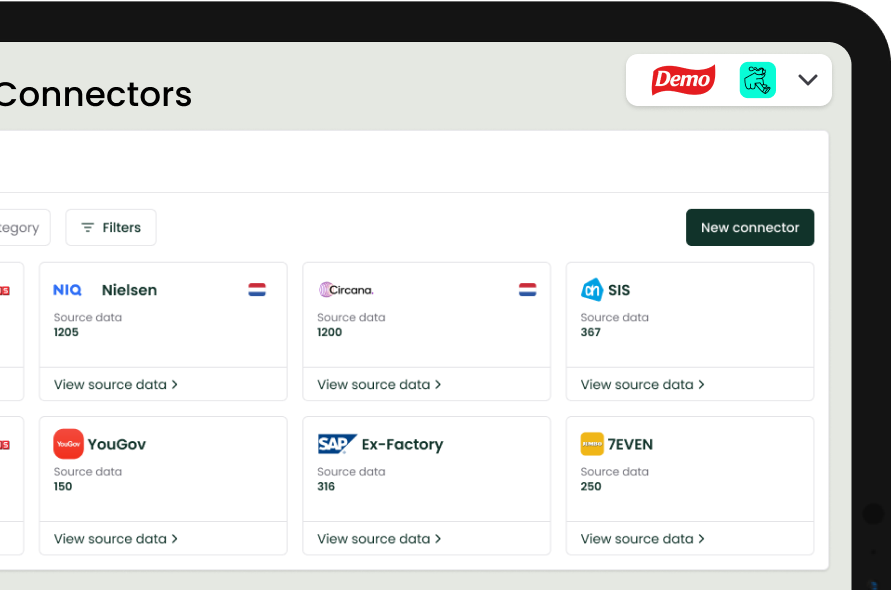
Data harmonization is one of the most time-consuming challenges category managers and trade marketeers face in their day-to-day work, and one of the least talked about. Every data source speaks its own language. Nielsen structures categories differently from Circana. SIS organizes products differently from 7EVEN. And your own internal product hierarchy rarely aligns with either.
Before any analysis can begin, someone has to translate. That translation is data harmonization, and in most FMCG teams, it still happens manually. The result is hours or days of work per reporting cycle that never makes it into a single insight.

Why data harmonization is harder than it looks
The problem starts the moment you open your first data export. You pull sales data from SIS for one retailer and from 7EVEN for another. Both sources cover the same products, but the category structures are built on completely different logic. What one source files under "breakfast" another splits into "cereals," "hot drinks," and "spreads." Comparing them directly gives you numbers that do not add up.
Add syndicated data from Nielsen or Circana into the mix, then pricing data from IPV or Superscanner, and your own internal data from your ERP or sales system. Suddenly you are dealing with four or five separate product hierarchies, each with its own EAN structure, its own naming conventions and its own level of granularity.
Making those sources comparable is the definition of data harmonization. And as long as it is done manually, it is a task that never truly ends.
Restatements: the data harmonization problem that keeps coming back
One of the most disruptive challenges in retail data harmonization is the restatement. A restatement happens when a retailer or data provider revises their category structure. Products get reclassified, subcategories are merged or split, and the historical data is updated to reflect the new structure.
For category managers and trade marketeers at the supplier side, a restatement means that all previous comparisons are now potentially invalid. Trend lines break. Year-on-year analyses no longer hold. Every mapping you have built needs to be checked and updated before you can trust the numbers again.
Without a systematic approach to data harmonization, a single restatement can set a team back by days. And since retailers manage their own timelines, these updates rarely come at a convenient moment.
The two approaches most teams use, and where they fall short
The most common approach is an Excel-based product mapping file. You build a table that links the category names from each source to your own internal structure, maintain it manually and update it whenever something changes. It works well enough when you set it up. But every new product, every EAN change and every restatement creates a new round of manual updates. A single error in the mapping file propagates through every report built on top of it.
The more robust approach is to build a master dataset. This is a central database where products from all your sources are linked to a single product structure. This master dataset becomes your single source of truth (SSOT). All analyses start from the same foundation, which ensures consistency across reports and across the presentations you bring to retailer meetings.
The limitation here is maintenance. Without automation, keeping a master dataset current requires continuous manual effort. New EAN codes need to be added. Restatements need to be processed. Structural changes in any source need to be reflected across the whole dataset. For most teams, this quickly becomes a full-time job in itself.
What good data harmonization enables for category management
The reason data harmonization matters so much in category management is that inconsistent data does not just cost time. It undermines credibility. When a trade marketeer brings a category plan to a retailer meeting based on data that is categorized differently from the retailer's own view, the conversation stalls before it starts. Instead of discussing strategy, you are reconciling definitions.
When data harmonization is done properly, the category plan and the retailer's own data tell a consistent story. That is the foundation for a conversation about insights and growth rather than about which numbers are right.
Beyond the retailer meeting, harmonized data unlocks analysis that is simply not possible when sources are fragmented. Combining syndicated data from Nielsen or Circana with POS data from SIS or 7EVEN and your own internal sales data gives you a view of the category that no single source can provide on its own. Price elasticity per SKU, promotional uplift modelling and forecasting all require this kind of integrated foundation to produce results you can trust. This is how you move from gutfeel to factbased decision making.
Automating data harmonization: from manual mapping to a live master dataset
The shift from manual Excel mapping to an automated master dataset changes the nature of the work entirely. Instead of updating mapping files after every change, new data is automatically matched against the central product structure when it arrives.
New EAN codes are recognized and linked without manual intervention. When a restatement occurs, the updated categorization is processed automatically and historical data is adjusted consistently across all reports. When a new retailer source is added, the harmonization logic maps it against the existing master structure without starting from scratch.
The result is a master dataset that is always current and from which you can report near real-time, if PoS data is available. The time that used to go into manual data crunching goes instead into analysis, category planning and preparation for retailer meetings.
Having a human in the loop is key and the ability to adjust or improve the data quality right away is essential. Automation handles the volume and the repetition. The category manager or trade marketeer remains responsible for catching exceptions and validating that the output makes sense. Data quality is the foundation. If the underlying harmonization is wrong, every analysis built on top of it will be wrong too.
What this means in practice for FMCG suppliers
Our experience with over 15 category teams at FMCG suppliers confirms that manual data harmonization typically consumes 60% of the available working time in a category or trade marketing team. That is time not spent on analysis, not spent building stronger category plans and not spent preparing for the conversations that actually drive growth.
When that manual work is automated, teams can cover more retail accounts with the same capacity, produce more category plans backed by data and respond faster to market developments. That is a win for the supplier and a win for the retailer: a partner who arrives at the table with consistent, up-to-date insights is a more valuable partner than one who arrives with Excel prepped visuals that took three days to build.
At Elho, this was the exact challenge. The category team was spending up to 60% of their time harmonizing data from 33 different retail channels. After automating that process with Captain, the number of data backed category plans grew from 10 to 25 and the team consistently arrived at retailer meetings better prepared and with stronger negotiating positions. Read the full case here.
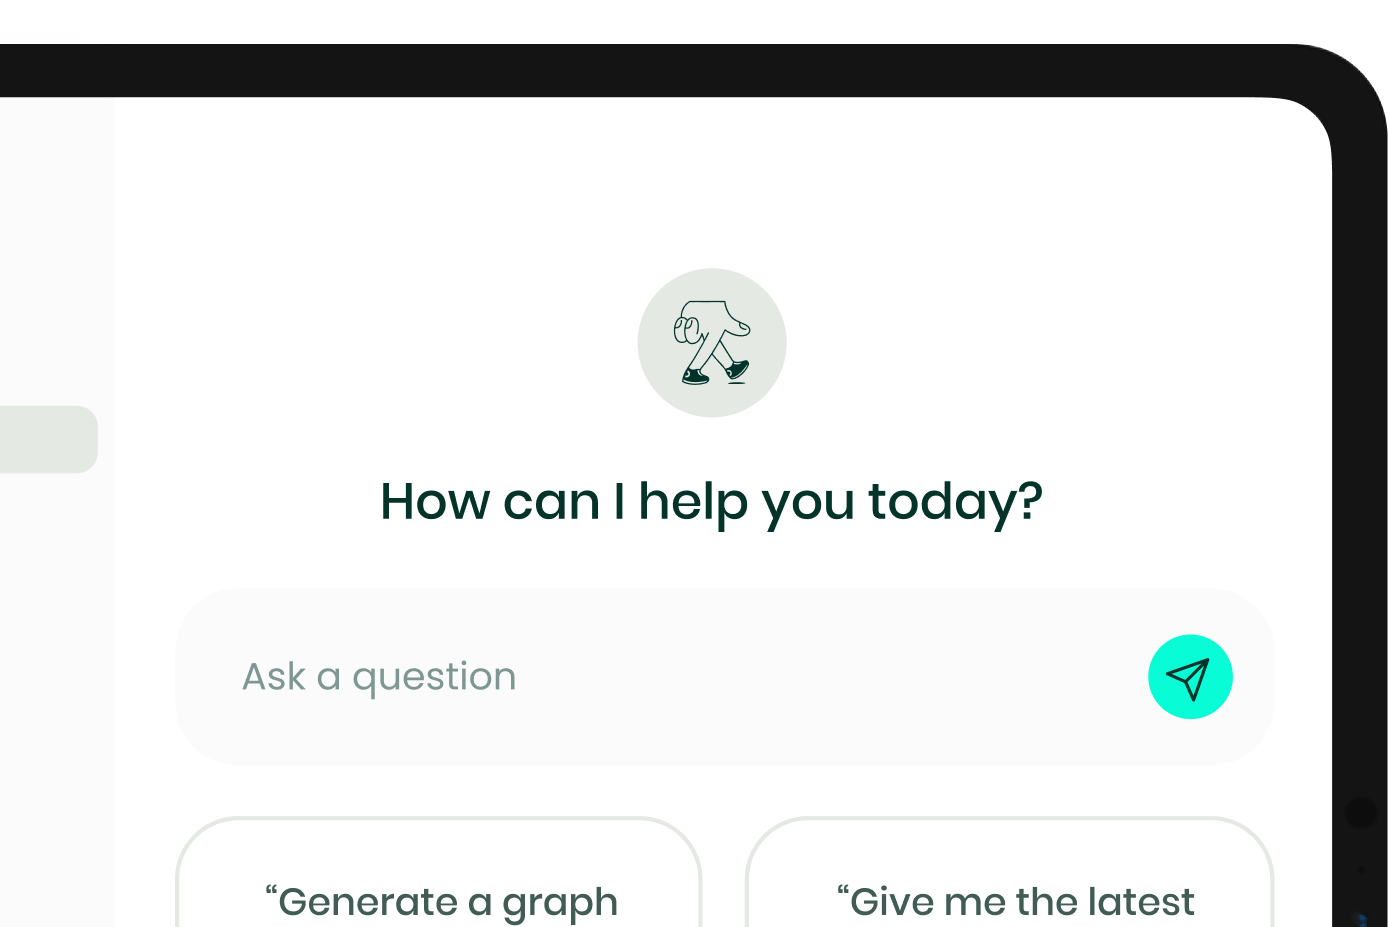
How Captain handles data harmonization
Captain automatically builds a master dataset from all the data sources your team already uses. Data from SIS, 7EVEN, Nielsen, Circana, IPV and Superscanner is mapped against your own internal product structure on arrival. New products and EAN codes are recognized and processed without manual steps. Restatements are handled automatically so historical comparisons remain valid.
The outcome is a single, consistent dataset from which your category team can analyze and report without a manual harmonization step in between. More time for the work that matters: building category plans, sharpening insights and walking into every retailer meeting prepared.
Request a demo to see how Captain handles your specific data sources, and come away with practical tips for your team's situation.

Article written by
Frequently asked questions about data harmonization
What is data harmonization in retail and CPG?
Data harmonization in retail and CPG is the process of combining product data from multiple sources, including retailer platforms, syndicated data providers and internal systems, into one consistent dataset. It goes beyond data integration by standardizing categorizations, naming conventions and product hierarchies across sources so that comparisons and analyses are reliable and consistent.
What is the difference between data harmonization and data normalization?
Data normalization focuses on optimizing the structure within a single database, removing redundancy and ensuring consistency within one system. Data harmonization goes further by aligning data across multiple separate sources. In category management, data harmonization is the relevant process: it ensures that data from Nielsen, Circana, SIS, 7EVEN and internal systems can be compared and combined without manual translation.
What is a restatement and why does it complicate data harmonization?
A restatement is a revision of the category structure by a retailer or data provider. Products are reclassified, subcategories are merged or split, and historical data is updated to reflect the new structure. For category managers and trade marketeers, a restatement means existing mappings need to be updated and historical analyses need to be checked. Without automated data harmonization, a restatement can set a team back by days.
How much time does manual data harmonization take in a typical FMCG team?
Based on our experience with category teams at FMCG suppliers, manual data harmonization typically consumes 60% of available working time per reporting cycle. The exact figure depends on the number of retail channels, the frequency of restatements and the number of data sources being combined.
How does Captain automate data harmonization for category management teams?
Captain automatically maps incoming data from SIS, 7EVEN, Nielsen, Circana, IPV, Superscanner and internal systems against your own product structure. New EAN codes are recognized and linked without manual steps. Restatements are processed automatically so historical comparisons remain valid. The result is an always current master dataset from which your team can report and analyze without a manual harmonization step.
Related posts

AI category management: how FMCG suppliers turn data into shelf wins
AI category management: how FMCG suppliers turn data into shelf win

The 4 AI Steps for Every Category Manager: Now or Later?
The 4 AI Steps for Every Category Manager: Now or Later?

Syndicated data and POS data in category management: what they are and how to combine them
Syndicated data and POS data in category management: what they are and how to combine them